Case study · Amazon US
Amazon account management case study: $6.5M in sales in 22 months
An established brand that had sold on Amazon for years but had stopped growing. We took over its ads in December 2024 and the whole account in March 2025. Every number comes from Seller Central or the Amazon Ads console. The brand name is hidden to protect our client.
Established brand · Amazon US
$6,536,394 sales in 22 months
- Store sales, Jul–Sep, year over year+24.3%
- Units, Jul–Sep, year over year+20.8%
- Sales, first full-management quarter+24.8%
- Ad sales, July, year over year+124.5%
Earlier period Later period
$6.54M
in sales in 22 months, December 2024 – September 2026
+24.3%
store sales, July–September 2026 against the same months of 2025
1000/1000
Account Health Rating, October 2026
The starting point
A brand that had stopped growing
- Selling on Amazon US for years, with a full catalog and its own brand
- Sales that weren’t growing month over month or year over year
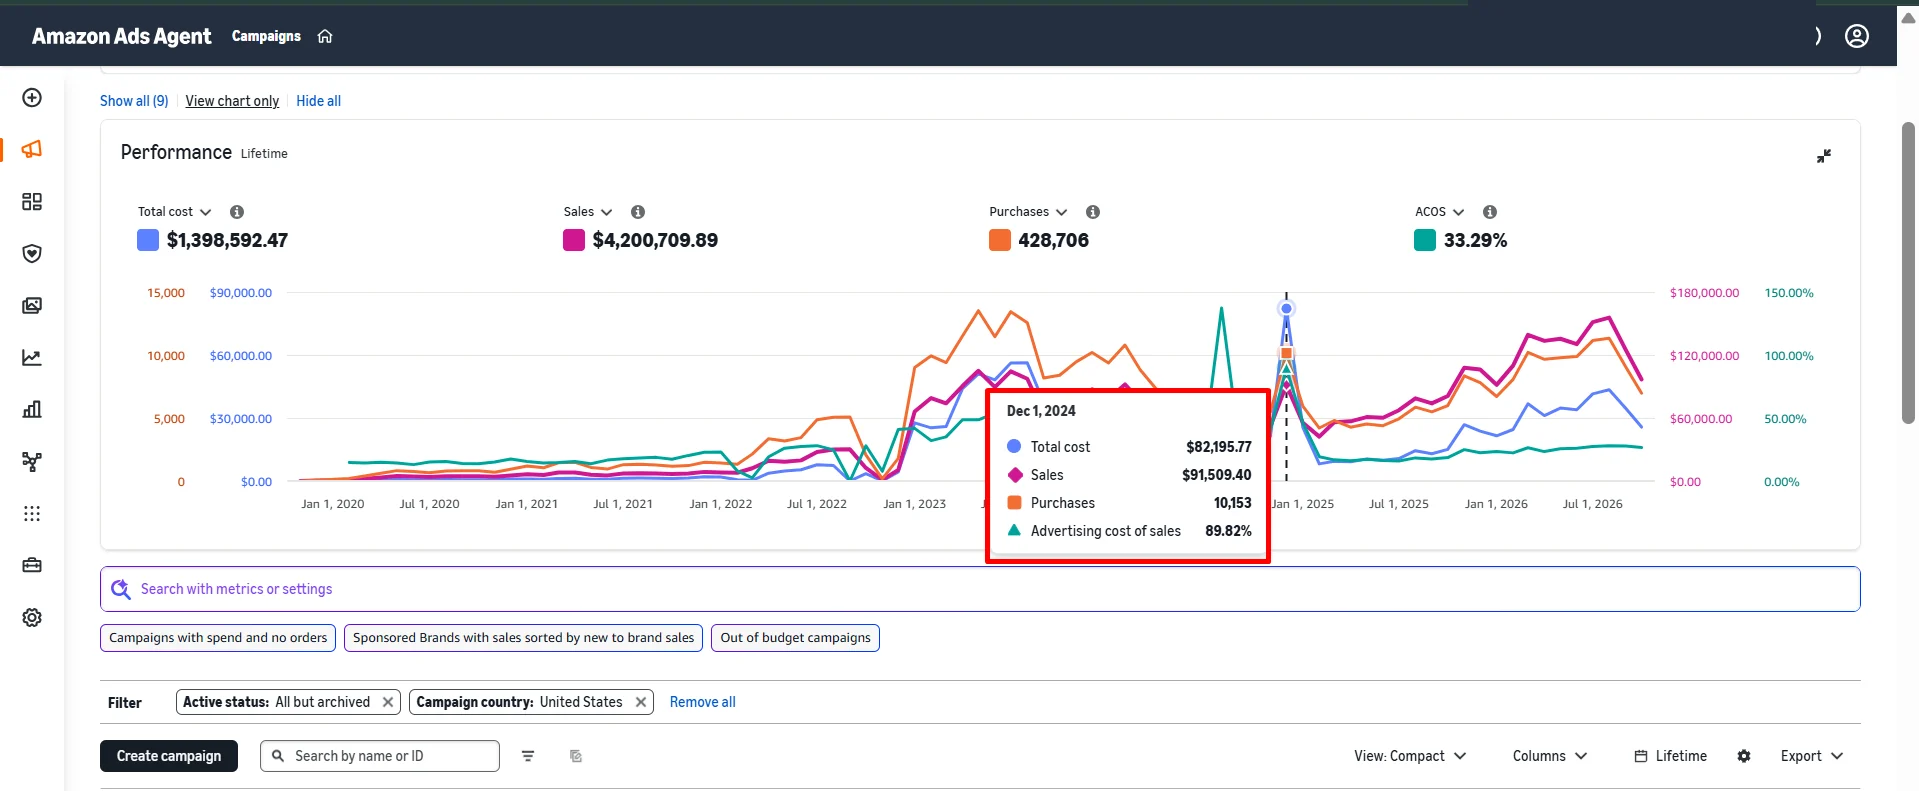
- High ad costs: 89.8% ACoS in December 2024, the month we took over the ads
- Listings, brand content and the Brand Store ready for a refresh
Our role
Full Amazon account management
- PPC: Sponsored Products, Sponsored Brands, Sponsored Display and brand defense campaigns
- Listing images, premium A+ content and Brand Story
- Listing copy and SEO: titles, bullet points, keywords and catalog data
- Brand Store (storefront) updates
- Inventory, FBA and FBM shipments and order operations
- Account health, policy checks and Seller Support cases
- Tracking of sales, units and ad results
Two stages
Ads first, then the whole account
December 2024 – February 2025
Ads only. We took over the campaigns: structure, targeting, bids and budgets.
March 2025 onward
Full account management. Listings, brand content, Brand Store, inventory, account health and ads, all run by one team.
First quarter of full management
Sales up 24.8% in the first three months
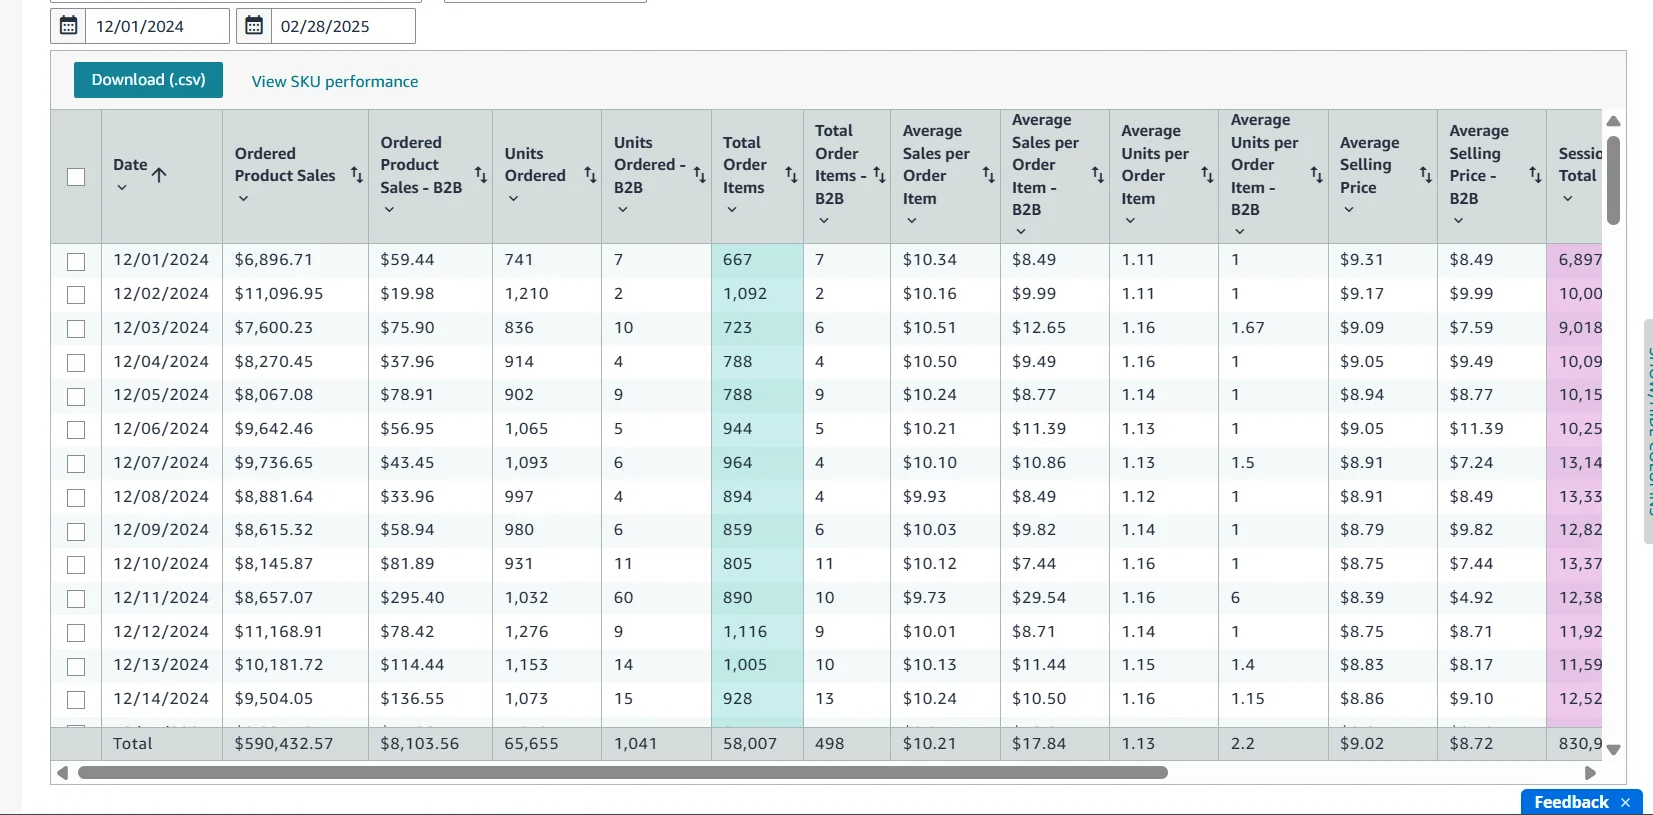
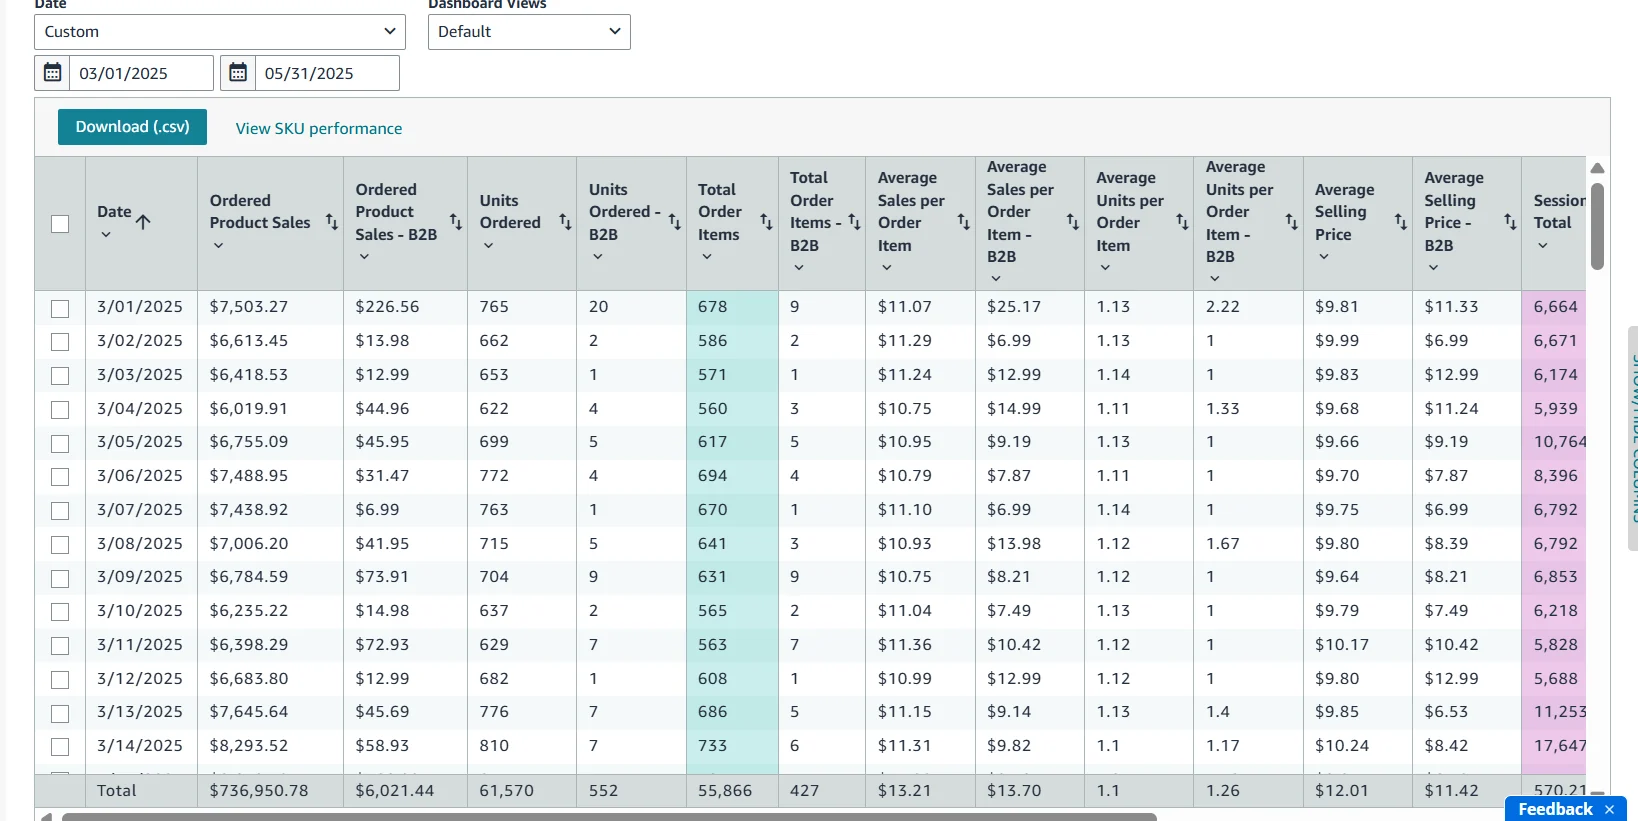
From Seller Central Business Reports: March 1 – May 31, 2025 (full management), compared with December 1, 2024 – February 28, 2025 (ads only).
| Dec 2024 – Feb 2025 | Mar – May 2025 | Change | |
|---|---|---|---|
| Ordered product sales | $590,432.57 | $736,950.78 | +24.8% |
| Units ordered | 65,655 | 61,570 | -6.2% |
| Average selling price | $9.02 | $12.01 | +33.1% |
Fewer units, but each sold for more, so sales still grew. The earlier period includes the December holidays, which usually lift sales.
Amazon ads
From 89.8% ACoS to 16% in four months, then scaled for growth
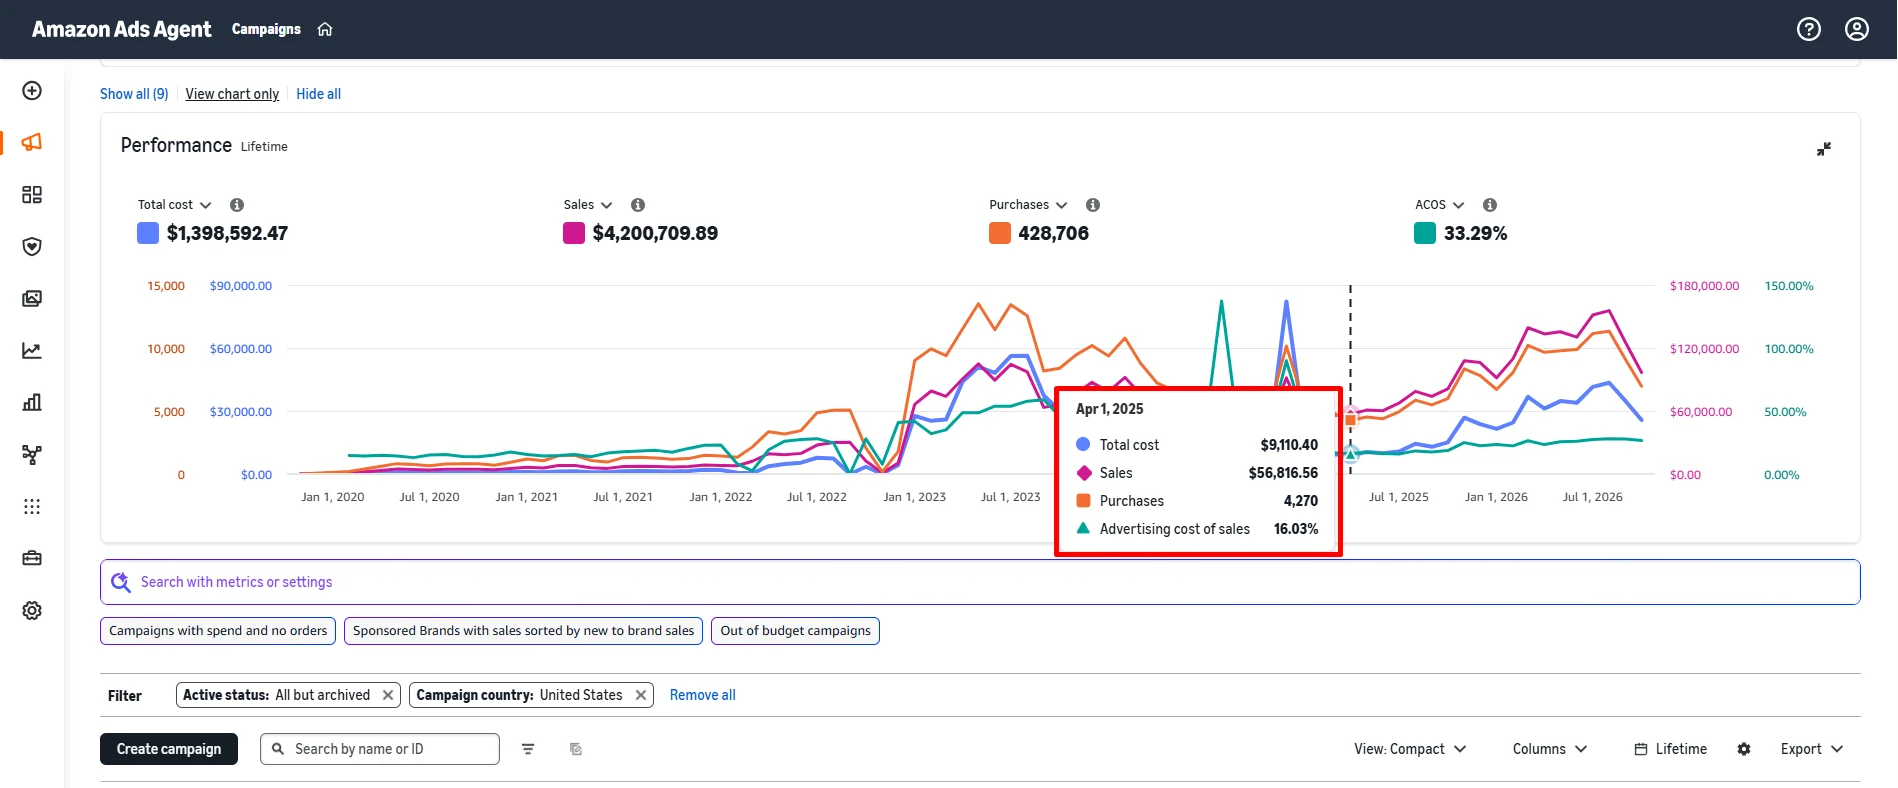
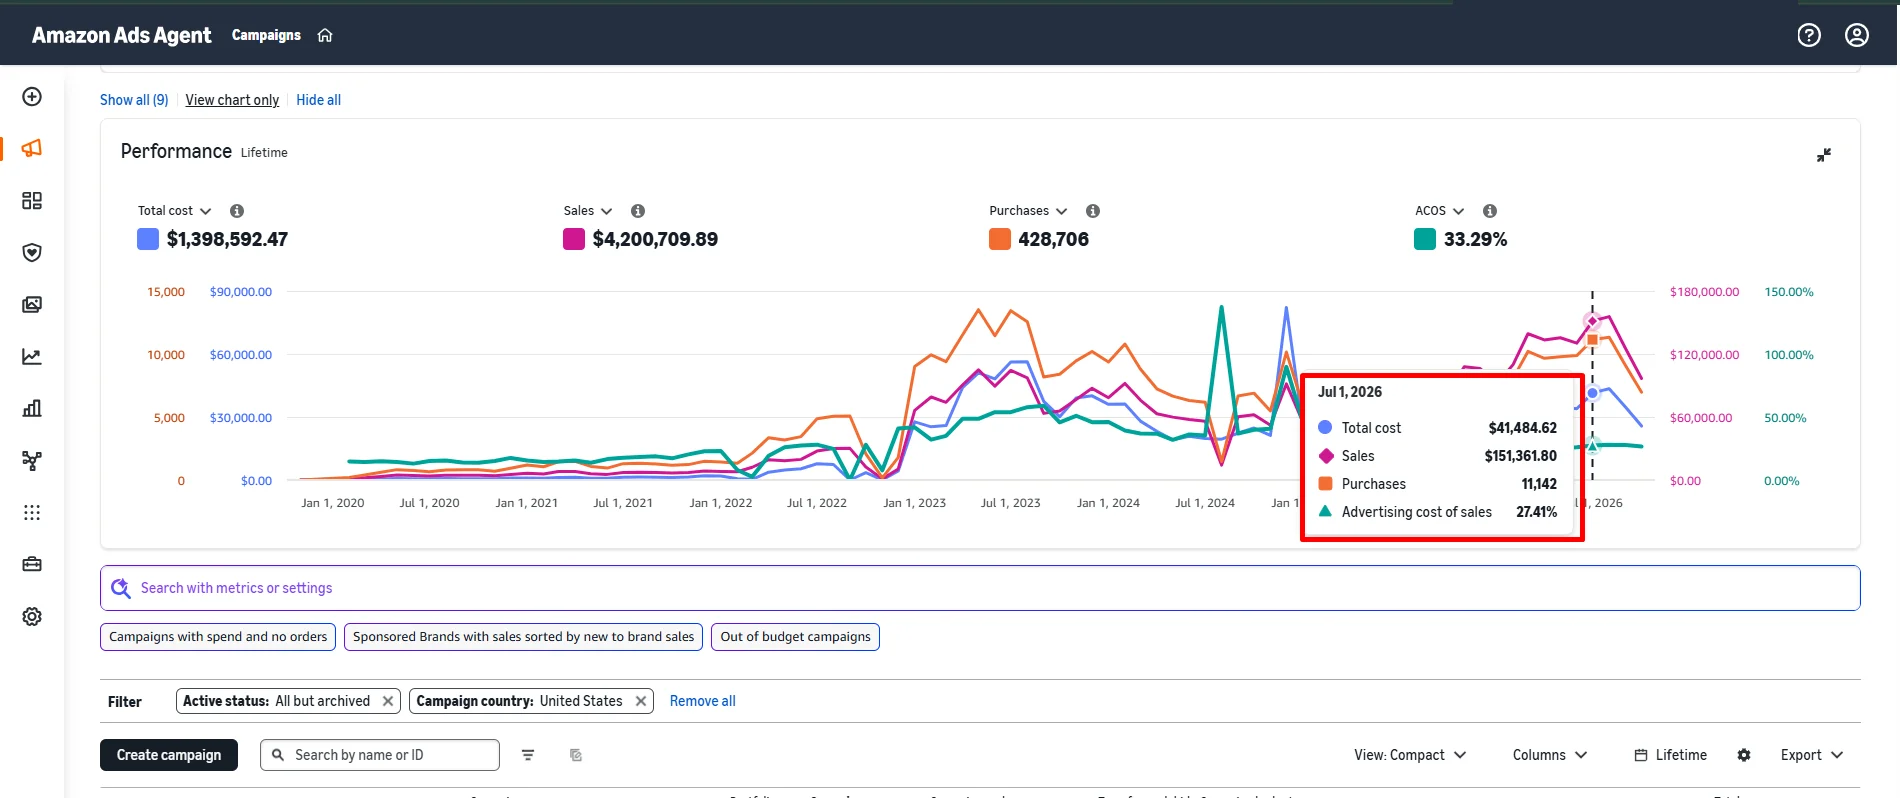
Monthly numbers from the Amazon Ads console (all campaigns, United States). In December 2024, our first month, ads cost $82,195.77 for $91,509.40 in ad sales. By April 2025, ACoS was 16.0%.
| Month | Ad spend | Ad sales | Orders | ACoS |
|---|---|---|---|---|
| December 2024 | $82,195.77 | $91,509.40 | 10,153 | 89.82% |
| April 2025 | $9,110.40 | $56,816.56 | 4,270 | 16.03% |
| May 2025 | $10,448.23 | $60,864.73 | 4,523 | 17.17% |
| July 2025 | $10,660.43 | $67,406.79 | 4,938 | 15.82% |
| September 2025 | $12,943.38 | $73,894.44 | 5,487 | 17.52% |
| October 2025 | $15,060.74 | $80,988.62 | 5,989 | 18.60% |
| July 2026 | $41,484.62 | $151,361.80 | 11,142 | 27.41% |
| August 2026 | $43,457.18 | $155,636.39 | 11,323 | 27.92% |
| September 2026 | $34,682.80 | $125,038.57 | 9,074 | 27.74% |
- July 2026: $151,361.80 in ad sales, up 124.5% on July 2025 ($67,406.79)
- September 2026: $125,038.57 in ad sales, up 69.2% on September 2025
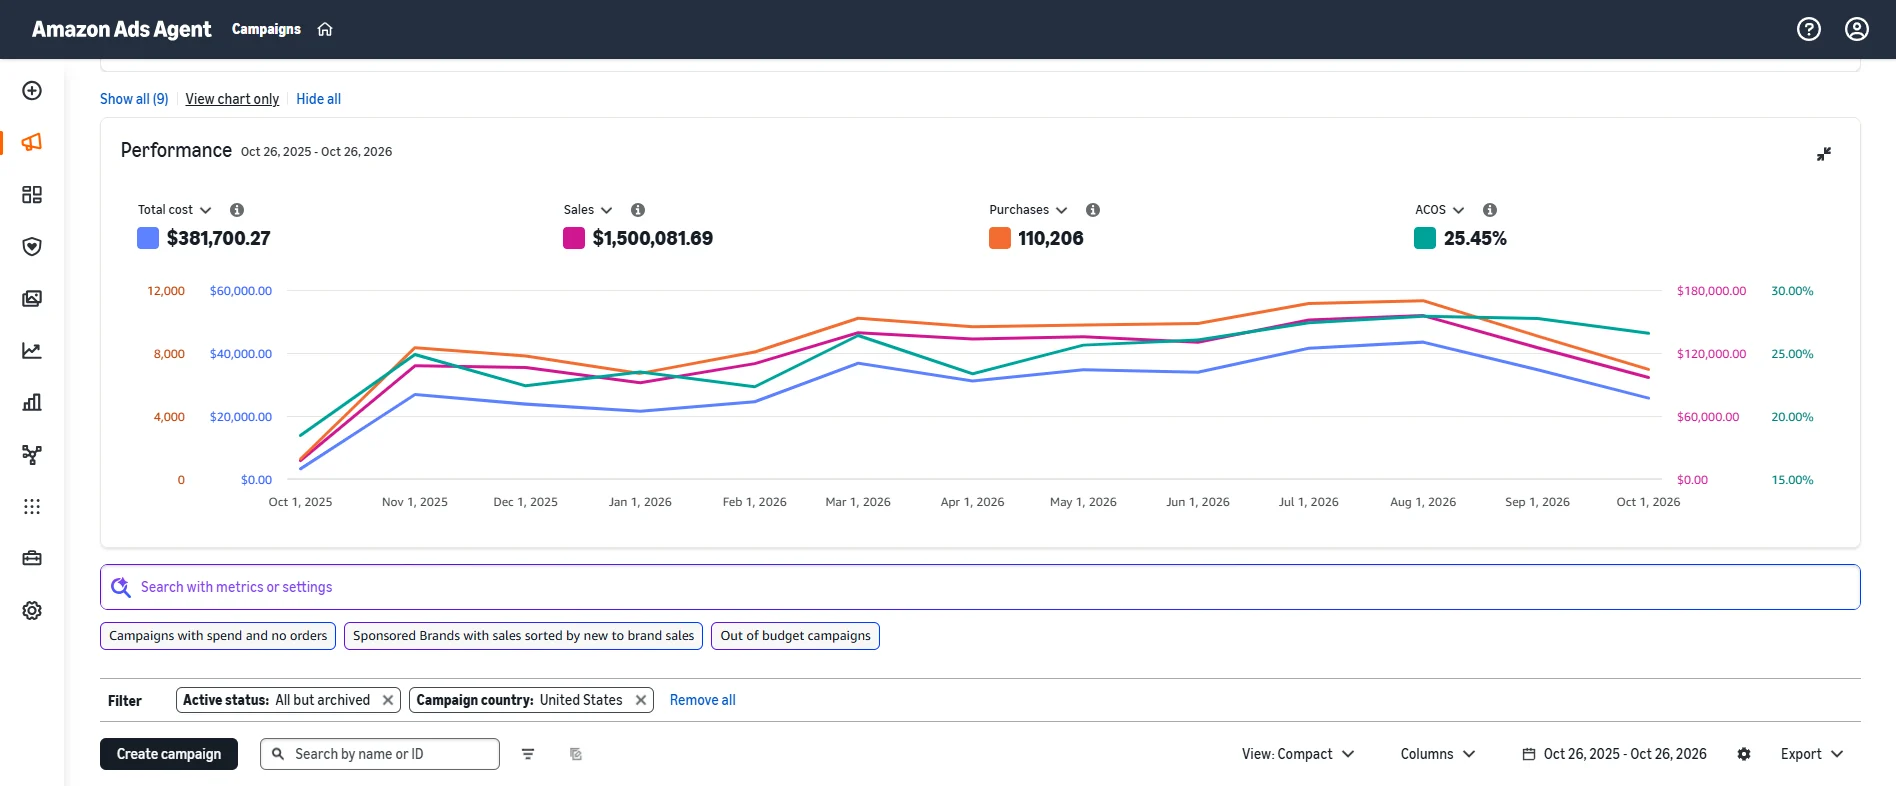
- Last 12 months (October 26, 2025 – October 26, 2026): $1,500,081.69 in ad sales from $381,700.27, a 25.45% ACoS
- July–September 2026: ad spend was 11.0% of store sales
In 2026 we chose to spend more on ads to grow. ACoS rose from about 16% to about 27%, while ad sales and store sales both grew.
Year over year
Store sales up 24.3%, units up 20.8%
The same three months a year apart, both under our full management: July 1 – September 30, 2025 and July 1 – September 30, 2026.
| Jul – Sep 2025 | Jul – Sep 2026 | Change | |
|---|---|---|---|
| Store sales | $876,528.01 | $1,089,292.22 | +24.3% |
| Units ordered | 69,486 | 83,936 | +20.8% |
From the Seller Central Business Reports download for those dates.
The bigger picture
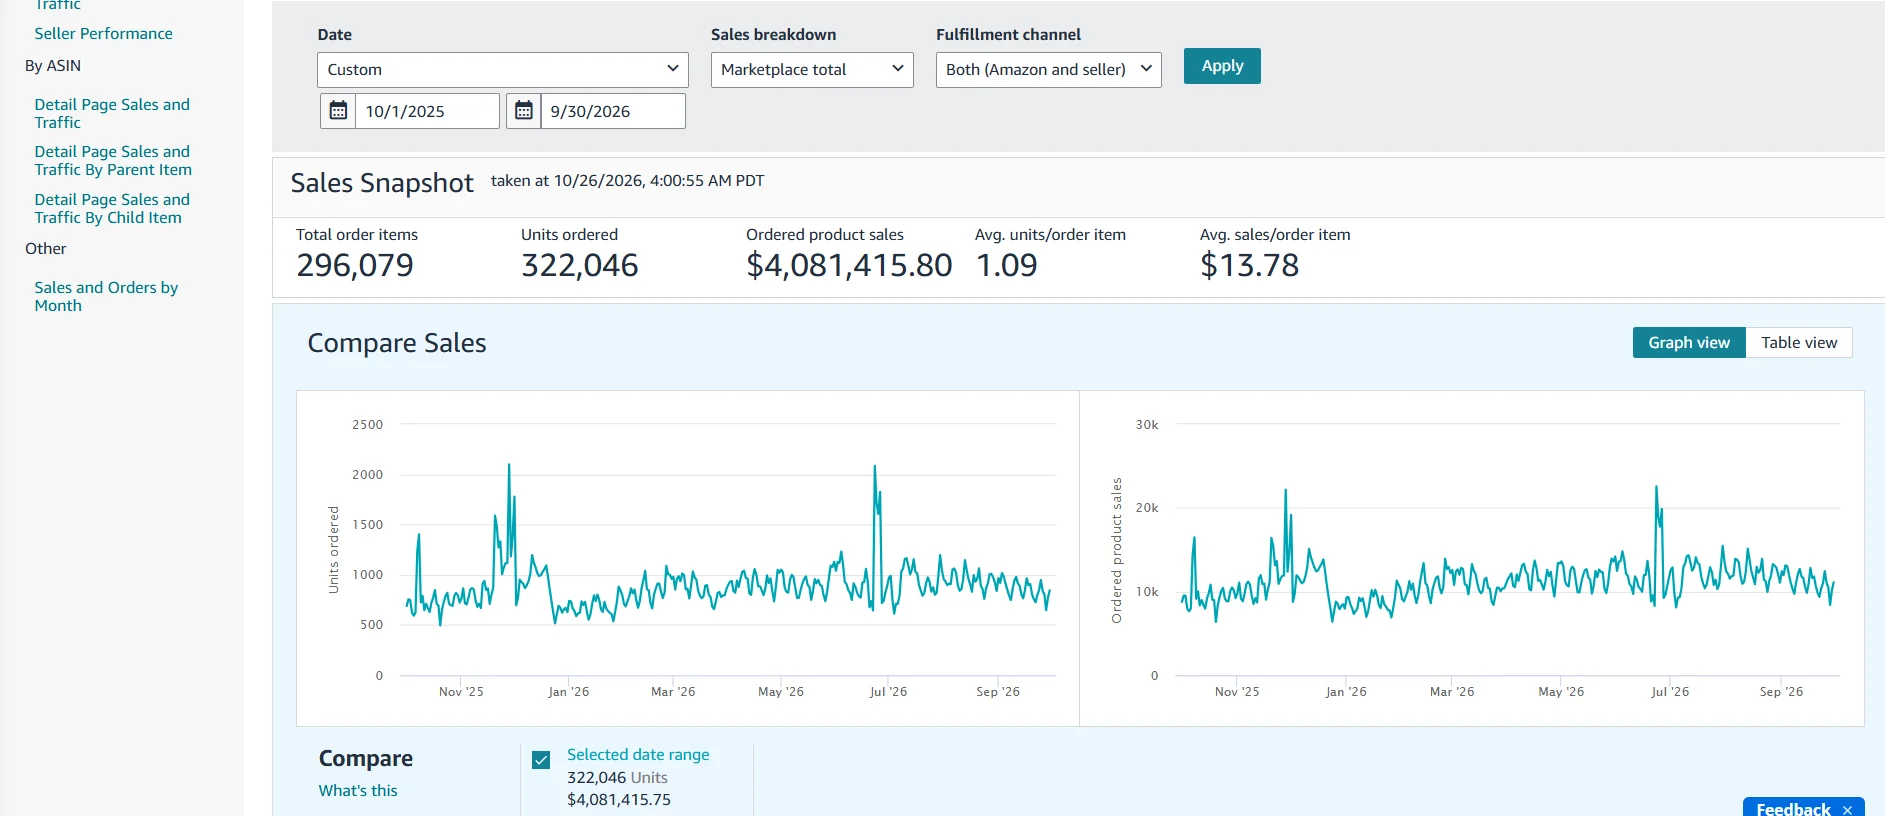
- Last 12 months (October 2025 – September 2026): $4,081,415.80 and 322,046 units
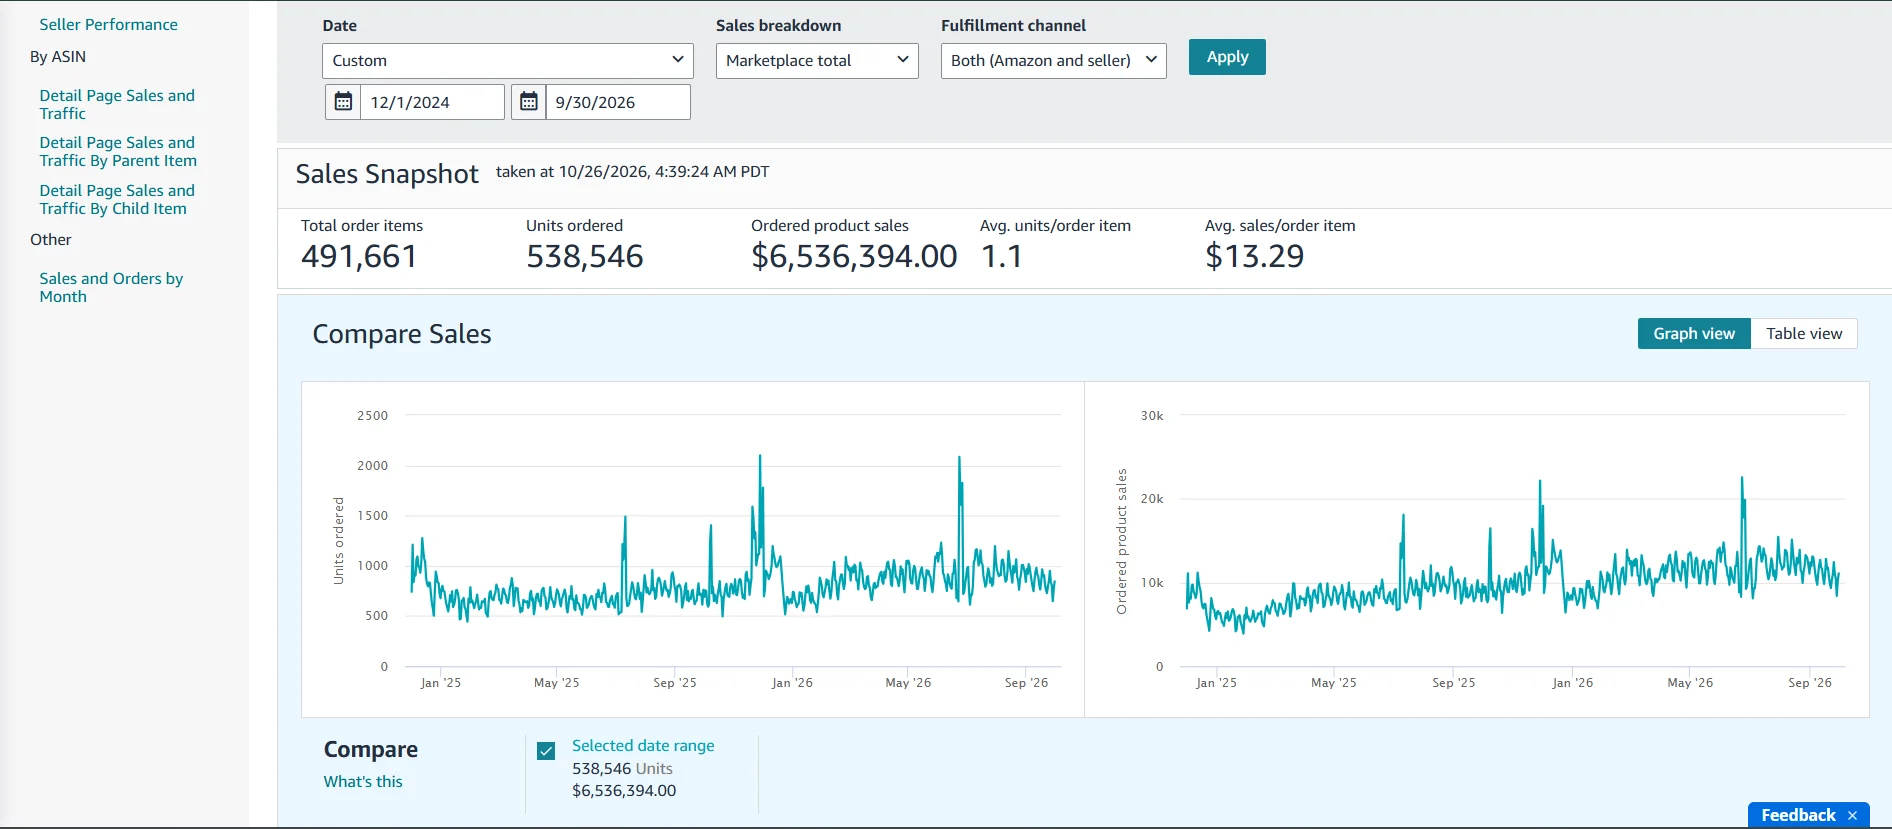
- 22 months with us (December 2024 – September 2026): $6,536,394.00 and 538,546 units
Account health
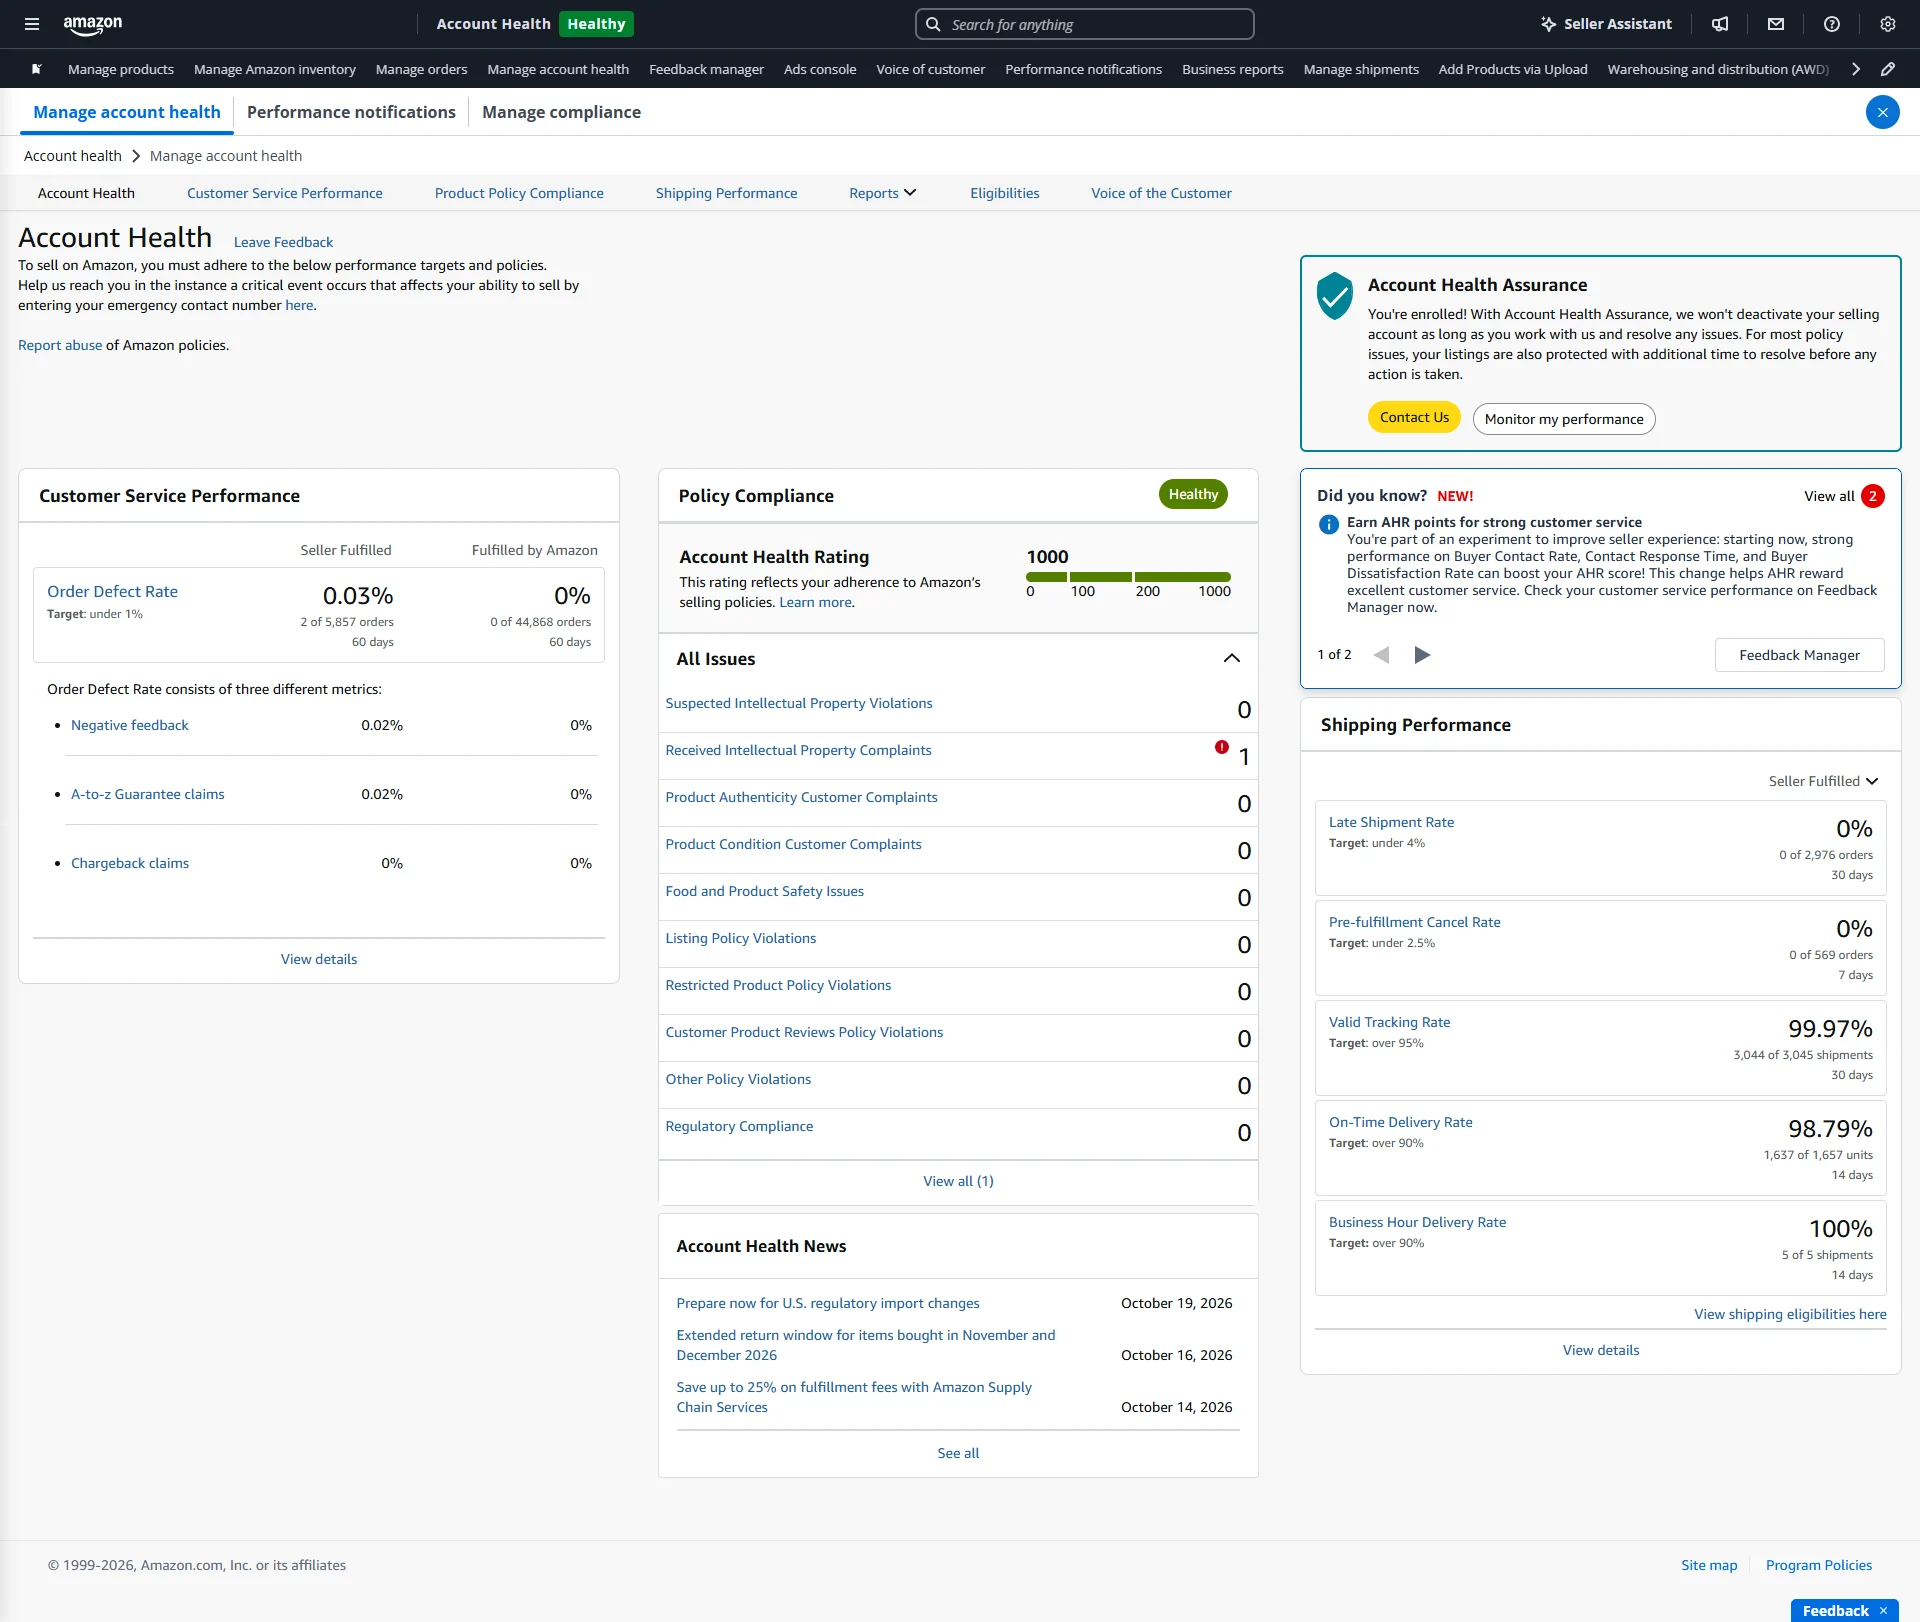
A 1000 / 1000 Account Health Rating
Seller Central Account Health, October 26, 2026.
- Account Health Rating 1000 out of 1000: Healthy
- Order defect rate 0.03% for seller-fulfilled orders (2 of 5,857) and 0% for FBA (0 of 44,868)
- Late shipment rate 0%, valid tracking rate 99.97% and on-time delivery rate 98.79%
- One intellectual property complaint is listed in the same report
About these numbers
- All numbers come from Seller Central and Amazon Ads console screenshots, or the Business Reports download for the same dates.
- December 2024 to February 2025 is the ads-only stage, not the time before we joined.
- Ad numbers cover all campaigns in the Amazon Ads console. Ad sales overlap with store sales and are not profit.
- The 22-month and 12-month totals include both stages of our work.
- Seasons, prices and the product mix also affect results, so no single action caused all of the growth.
More case studies
Results on other marketplaces
Amazon US
$25M+
in sales across three private label stores
From zero to $100K+ months in one year
Store A launched in October 2025. October 1–29, 2026: $112.8K, 3.2x the same days a year earlier.
TikTok Shop US
+117%
shop GMV in 11 months
A fragrance shop more than doubled its sales
GMV Max ads at a 4.07 reported ROI, and sales from creators up 609%.
eBay
+449%
sales in 12 months
A small eBay store grew 5.5 times in a year
Promoted Listings at a 3.63x return on ad spend, and an Above Standard seller level.
Walmart
+221%
ad sales across 9 matched months
Ad sales tripled and catalog errors hit zero
July ROAS rose from 4.84x to 5.94x, and a seller appeal got listings back on.
Want your Amazon brand growing again?
Get a free Amazon audit. We’ll check your listings, ads and account health, and tell you what to fix first.